Grid-Hawk is a sophisticated software platform designed for the advanced visualization and analysis of electricity consumption data, collected from a network of smart meters and transformers via an advanced monitoring system utilising and RF modules with communication network deployed in the field.
Stop Reacting to Grid Problems. Start Preventing Them.
Your distribution network is the backbone of your revenue, but hidden inefficiencies and energy losses can silently drain your profits. It's time to move from reactive maintenance to proactive mastery with our revolutionary Grid Monitoring & Anomaly Detection System. We turn your raw data into actionable intelligence and real dollars.
Why Our System is a Game-Changer for Your Network:
- Total End-to-End Visibility: We don't just monitor one part of the line. Our system integrates directly from the distribution transformer all the way to the customer meter, giving you an unprecedented, complete picture of your network's health. You can't fix what you can't see. We let you see everything.
- Unmatched Precision for Early Detection: While other systems might miss subtle clues, ours captures high-resolution data every fraction of a second (sampling at 1.4 kHz). This extreme precision allows our AI to detect the smallest anomalies—like tampering or failing equipment—long before they become costly problems.
- A Fully Automated, "Always-On" Network: Forget manual data collection. Our robust RF mesh network and modern 4G/LTE connectivity create a seamless, self-operating nervous system for your grid. Data flows wirelessly and instantly from every point to a central server, 24/7.
- Intelligence That Works for You: Our central server isn't just a database; it's the brain of the operation. It instantly analyzes incoming data, identifies suspicious patterns, and generates real-time alarms. This means your team can focus on solutions, not searching for problems.
- Powered by Cutting-Edge Machine Learning: At the core of our system are advanced machine learning algorithms. It doesn't just follow rules; it learns the unique behavior of your network. This allows it to become smarter over time, accurately predicting future issues and distinguishing between normal high usage and genuine threats to your revenue.
Turn your distribution network into a smart, secure, and profitable asset. Stop losing revenue to the unknown and start guaranteeing your operational efficiency.

Software Specifications
Visualization Engine: The platform is built upon Grafana, the industry-leading open-source platform for interactive analytics and monitoring. This provides a flexible, powerful, and user-friendly interface for all visualizations.
Data Integration: It utilizes a custom-built AMI (Advanced Metering Infrastructure) Web Service to securely and efficiently retrieve real-time and historical data from the distributed network of RF modules installed on the meters and transformers.
Architecture: The system is architected to handle high-volume time-series data, enabling fluid charting, rapid querying, and complex analysis of large historical datasets without performance degradation. The edge processing unit collects high frequency sensor data to detect and localize losses using AI approaches in the substation area.
Accessibility: As a fully integrated web-based platform, users can access all dashboards and analytics securely from any standard web browser, eliminating the need for local software installation and maintenance.
General Project Features
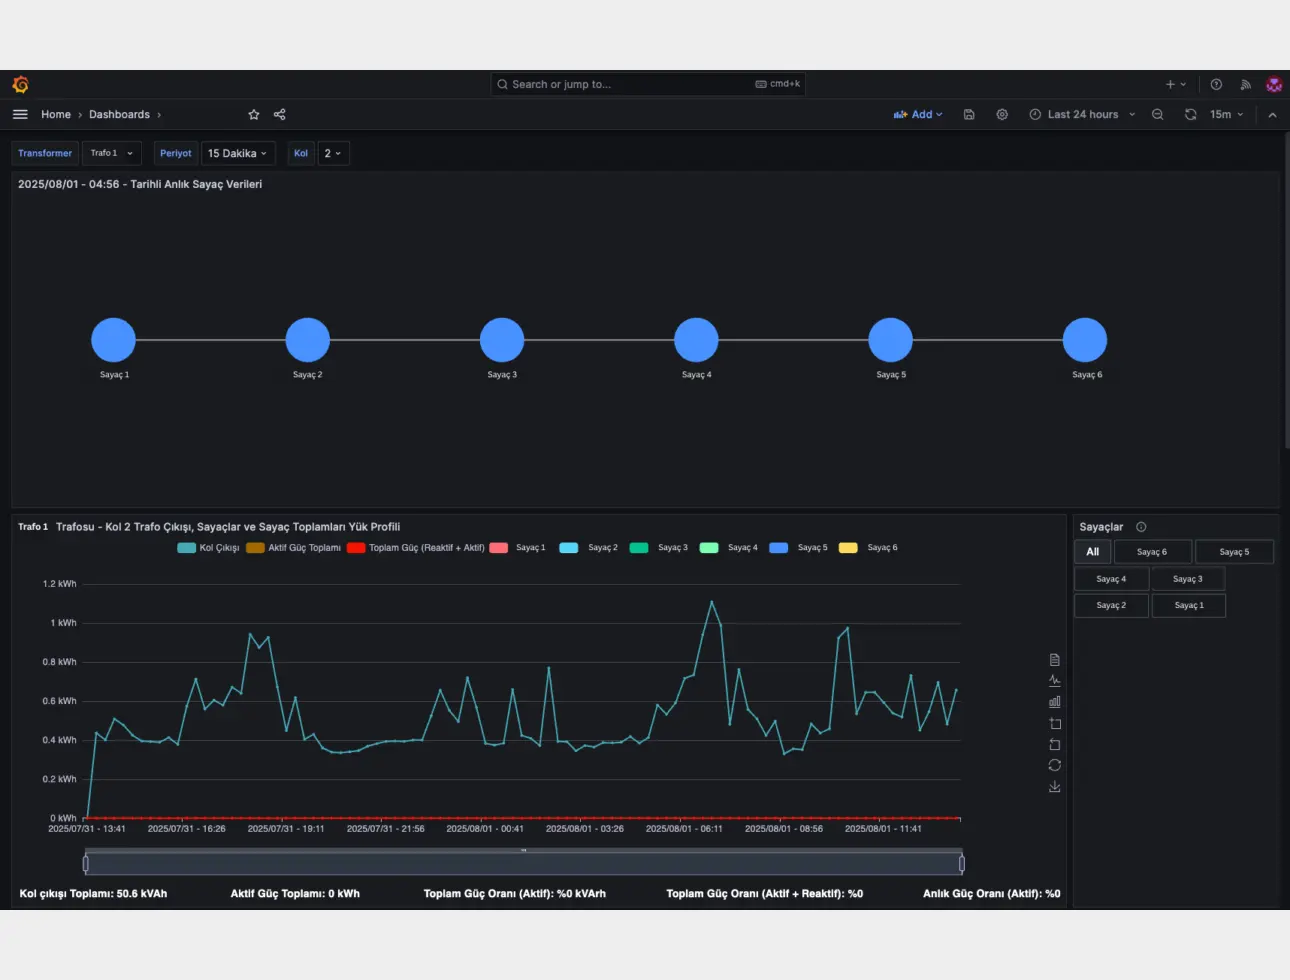
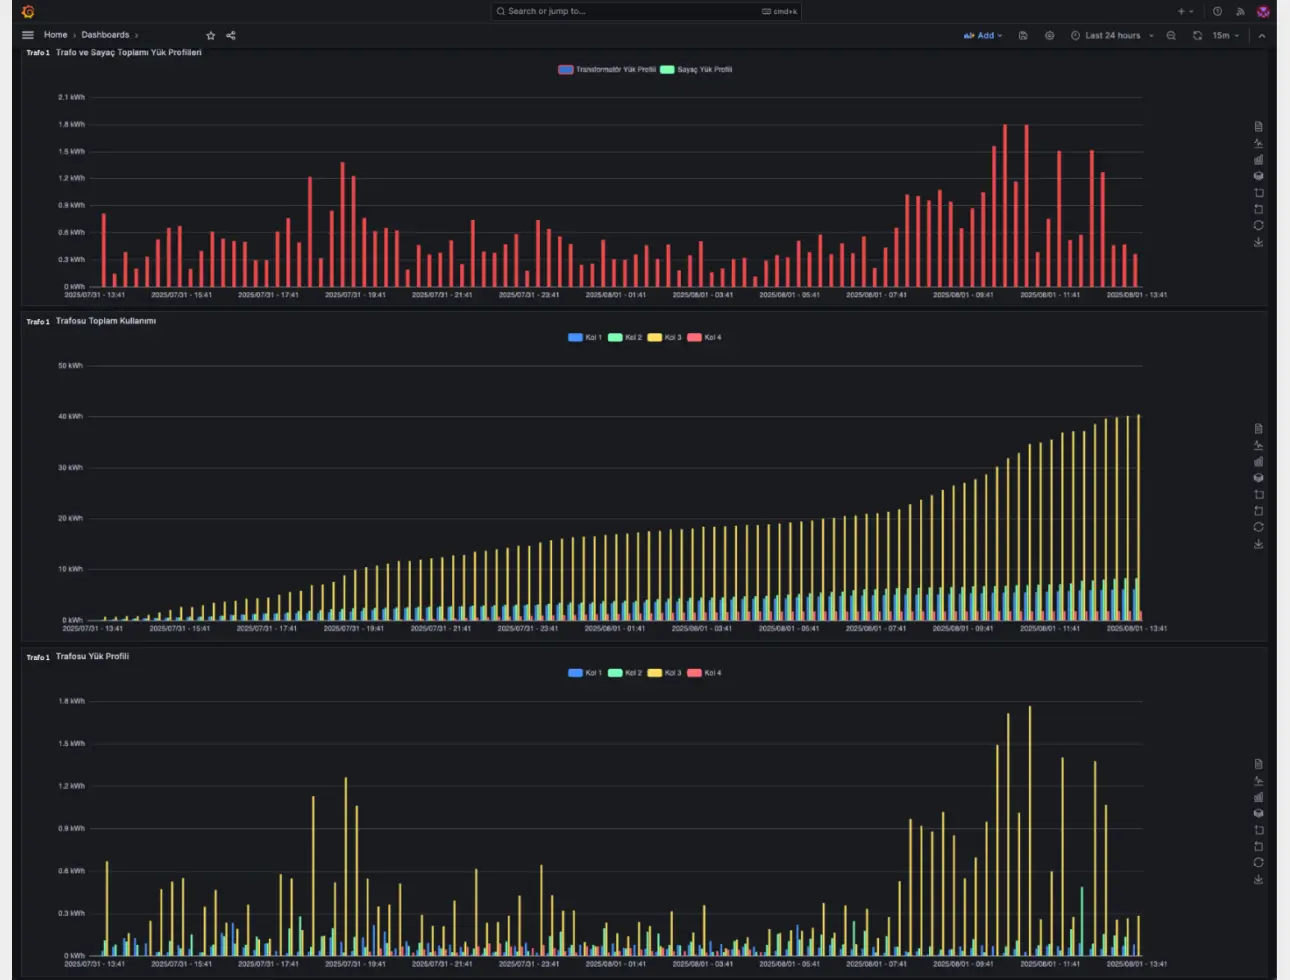
Hierarchical Data View: Users can monitor energy consumption at multiple levels—from a high-level transformer overview down to the load profiles of individual areas and specific end-user meters.
Device Filtering: Dynamically select and isolate data for a single meter, a custom group of meters, or an entire transformer branch for focused or comparative analysis.
Time-Range Control: Select predefined time ranges (e.g., daily, monthly, yearly) or specify custom start and end dates for in-depth historical review and trend analysis.
Customizable Data Granularity: Adjust the data aggregation period on-the-fly, allowing users to view consumption profiles in various intervals (such as 1-minute, 15-minute, or 1-hour blocks) to identify short-term peaks or long-term trends.
Interactive & Versatile Visualizations: Switch between multiple graph types (e.g., line charts for trends, bar charts for comparisons) to best interpret the data. Also dashboards are fully interactive, with hover-over data points, zoom capabilities, and dynamic legends.
Export & Reporting: Easily export any graph or visualization as a high-quality image file (e.g., PNG), making it simple to include data in reports, presentations, or offline analysis.
Load Profile Analysis: The platform's core capability is providing clear, actionable insights into the load profiles of both transformers and consumers. This is critical for efficient grid management, proactive fault detection, and strategic capacity planning.